Being able to see dynamically the frequency content of the music playing is a goal of mine for a long while. I remember studying about Fourier Analysis at University so understand the principle of taking samples and then performing the mathematical transform into the frequency domain.
In today’s world of high speed microcomputers, even an Arduino can perform a 256 sample FFT in 7ms. In the end creating a fairly sophisticated Spectrum analyser is easier than expected, the maths is all done by some fantastically written libraries and displaying to a screen is straightforward. The hardest challenge is sampling the data.
The Arduino has 8 analogue inputs and can be readily configured to sample at 38.4kHz, giving a spectrum bandwidth of 19.2kHz. This is an extended audio band. Reducing the resolution to 8 bits gives a dynamic range of 2**8 or about 64dB. Again adequate for a visual and non-scientific display. Using the i2c bus this is transported to a raspberry Pi for manipulation and onwards display.
I shall be placing the Arduino and R-Pi code on Github presently. [NB: Circuit diagram to be provided also].
The real time aspects of this project are quite complex: to get a finer resolution of frequencies, requires a longer sample time. A longer sample time means there is more of a lag in displaying the outcome. I am optimising the design at 1024 samples which provides an update rate of around 10 frames per second with a resolution of 37Hz.
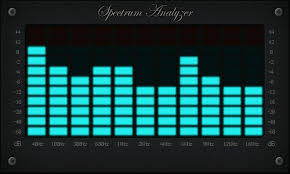
Finally a word to how to make the display look right. The human eyes and ears do not work linearly – they are logarithmic. This means that we respond to a doubling of of loudness or frequency. For example, the note A below middle C is 440Hz, the A higher is 880Hz and lower 220Hz. It follows then that the Spectrum analyser should present the frequency axis in Octaves also. The convention is either to display Octaves (i.e. 8 bars from 31Hz to 16kHz) or 1/3 Octave which is 24 bars. Loudness is similar. The ear is very sensitive to loud and soft sounds so the display uses a Log base 2 calculation (conversion to dB) so that the quieter sounds are more in evident than the loud which are compressed. So using log2 scales on the amplitude and frequency axes of the Spectrum analyser ensure that the result looks right.
